Global Non-Cash Payments: Trends and Forecasts
Abstract
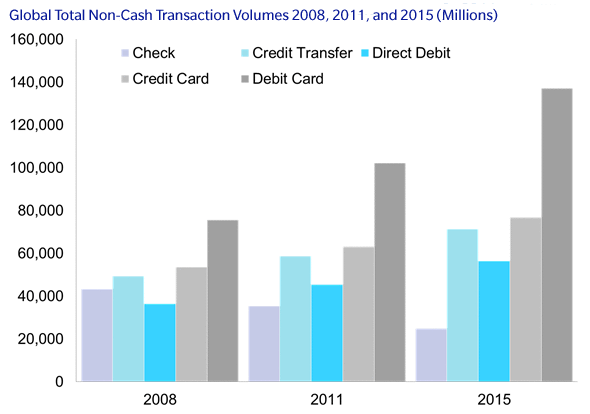
In 2011, despite the economic crisis, non-cash payment volumes grew by 5.0% to 304.8 billion transactions, with debit cards now the most favored payment instrument.
In the report Global Non-Cash Payments: Trends and Forecasts, Celent summarizes payment statistics it has tracked from over 120 countries, by both payment type and region.

“Two clear trends stand out,” says Gareth Lodge, Senior Analyst with Celent’s Banking Group and author of the report. “First, debit cards saw the greatest levels of growth over the period 2008-2011, in both percentage and absolute terms. Much of this growth has come at the expense of other payment types, but particularly seen by many consumers as a direct cash substitute. Instead of using the card at an ATM and using that cash to pay, they view using the card as merely shorting that process.”
“The second key trend is checks are dying out rapidly across the world, with a 6.6% CAGR reduction across the period examined,” he adds. “While we believe the death of checks is imminent in some countries, in others it most certainly isn’t likely. For example, in 2011 the US wrote nearly 60% of all checks, globally. That’s going to be a tough habit to break.”
This report is based on Celent’s Global Payments Database. This database brings together the wealth of information Celent analysts collect during their research. While much of the data may be publicly available, the interpretation and triangulation of this data are an integral piece of the database. Having studied payment systems in over 100 countries, we understand the challenges of comparing apples with apples, particularly because the data often differs from source to source. This report also draws on data collected on many other aspects, from regulatory environment to numbers of mobile phone subscriptions to numbers of ATMs.
This 36-page report contains eight figures and seven tables.

